// case study · 2025
SaaS Analytics Dashboard
Cut report load time by 68% and shipped MVP in 6 weeks.
Next.jsPostgreSQLCharts
Problem
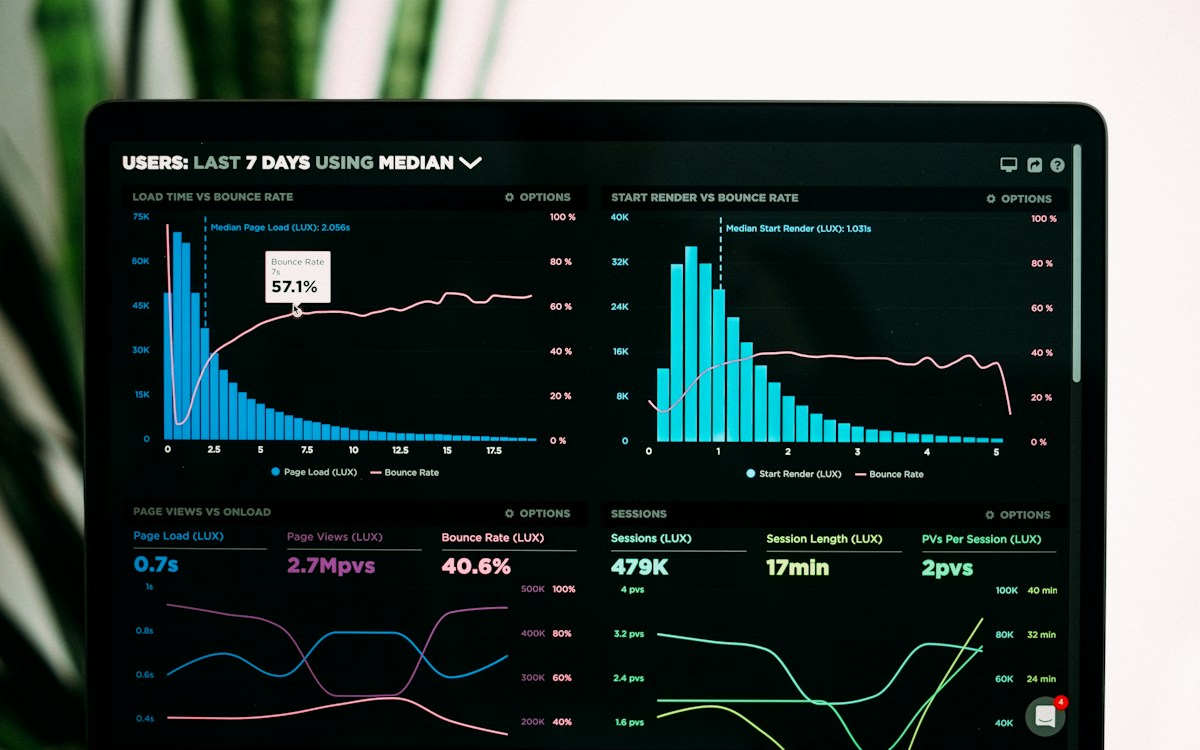
The client's existing reporting UI was slow, hard to extend, and confusing for non-technical users. They needed a full-stack rebuild without disrupting paying customers.
Approach
I redesigned the information architecture, moved heavy aggregations to the API layer, and rebuilt the UI in Next.js with cached queries and progressive loading for charts - end-to-end ownership from database to deploy.
Tech stack
Next.jsTypeScriptPostgreSQLPrismaRechartsVercel
Outcome
Report pages that previously took ~4s now load under 1.3s. The team launched on schedule and onboarded three new enterprise accounts using the new dashboard.
“Vikram didn't just rebuild the UI - he fixed the data path. Exactly what you want when you hire a full-stack developer.”